S. K. Gupta Anubhuti Gangal Class 5 Math Nineteenth Chapter Data Handling Exercise 57
EXERCISE 57
DATA: A collection of information in the form of numerical figures is called data.
STATISTICS: The branch of mathematics used for collecting, organizing and studying set of data is called statistics.
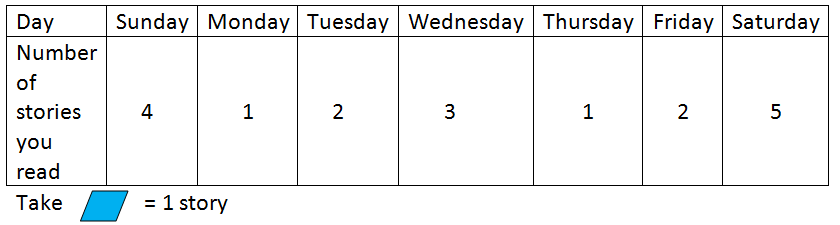
(1) Draw a pictograph to show the number of stories you read from your favorite story book reach day in week.


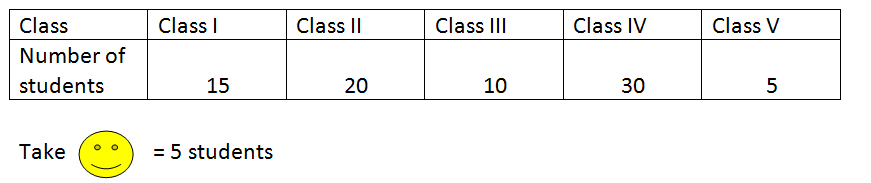
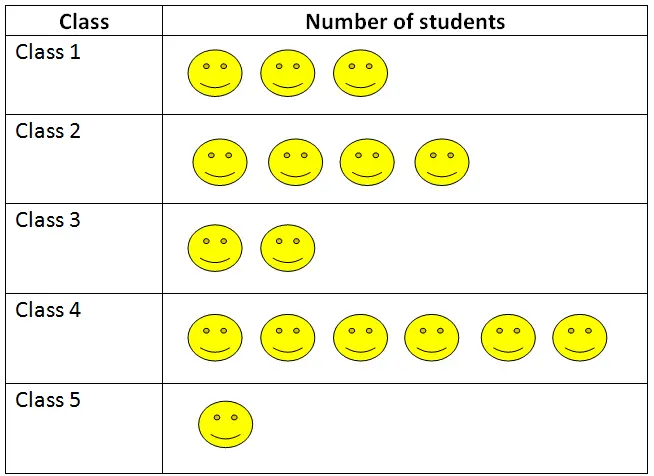
(2) Draw a pictograph to show the number of students who attended a dog show in school from each class of the Junior school.


(3) Draw a bar chart to represent the number of students who visited the school library in a week. Use a graph paper to draw the graph


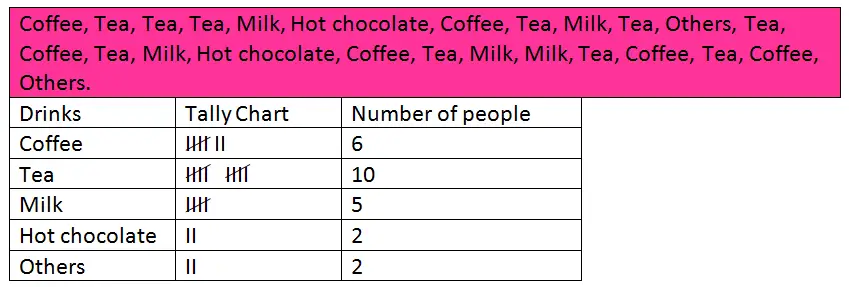
(4) A survey was done on 25 people on their choice of drinks and the individual response was as given below:

(5) The students of class 5 were given their choice of animals to research for a project in science. The results of their choices were displayed with the help of a bar graph. Look at the bar graph given below and answer the questions that follow:

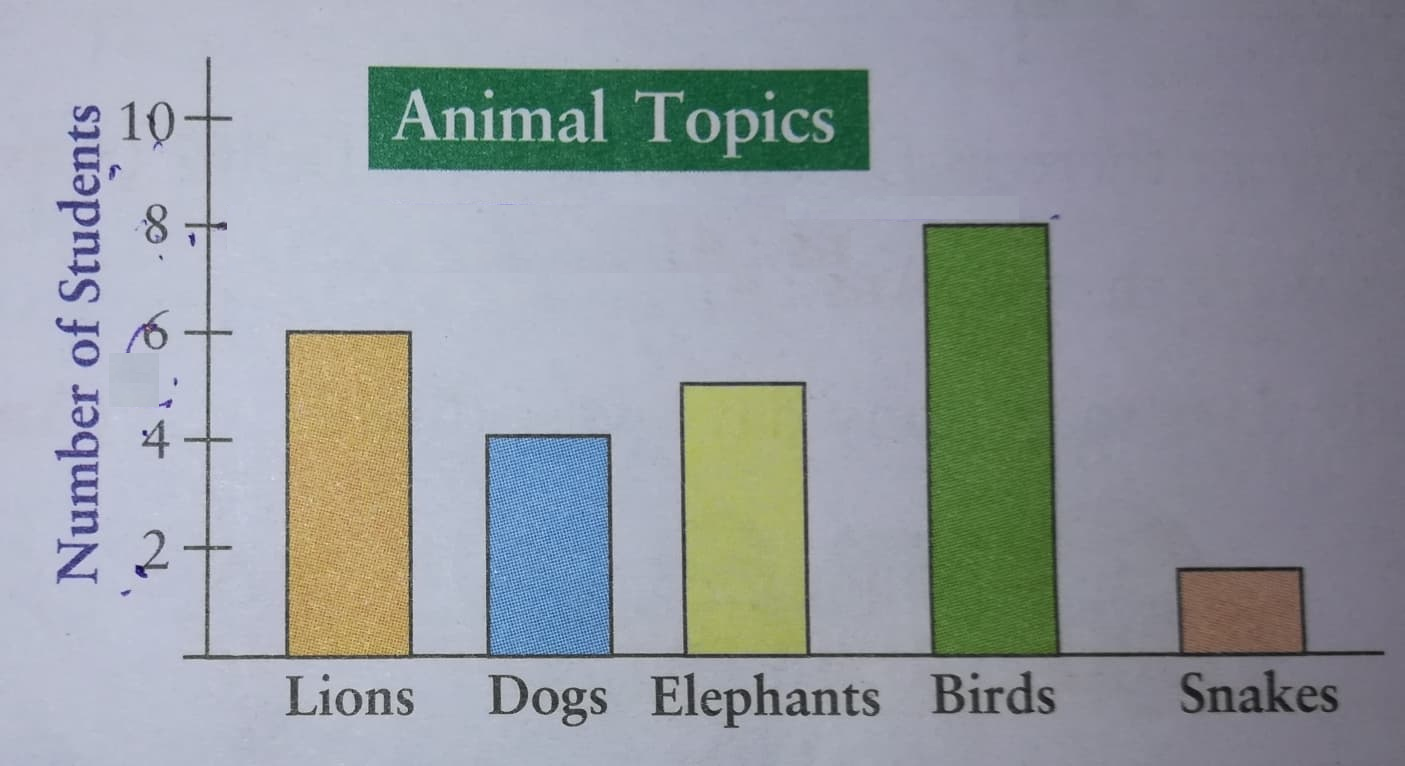
(a) Which is the most popular topic?
Ans: Birds
(b) Which is the least popular topic?
Ans: Snakes
(c) The number of students who chose dogs and snakes is equal to the number of students who chose what other topic?
Ans: Lions
(d) What is the total number of students in the class?
Solution: 25
(e) Express the number of students who chose snakes as a fraction of the strength of the whole class.


(6) The following graph shows the choice of future careers of middle school students of a school. Use the bar graph to answer the questions given below.

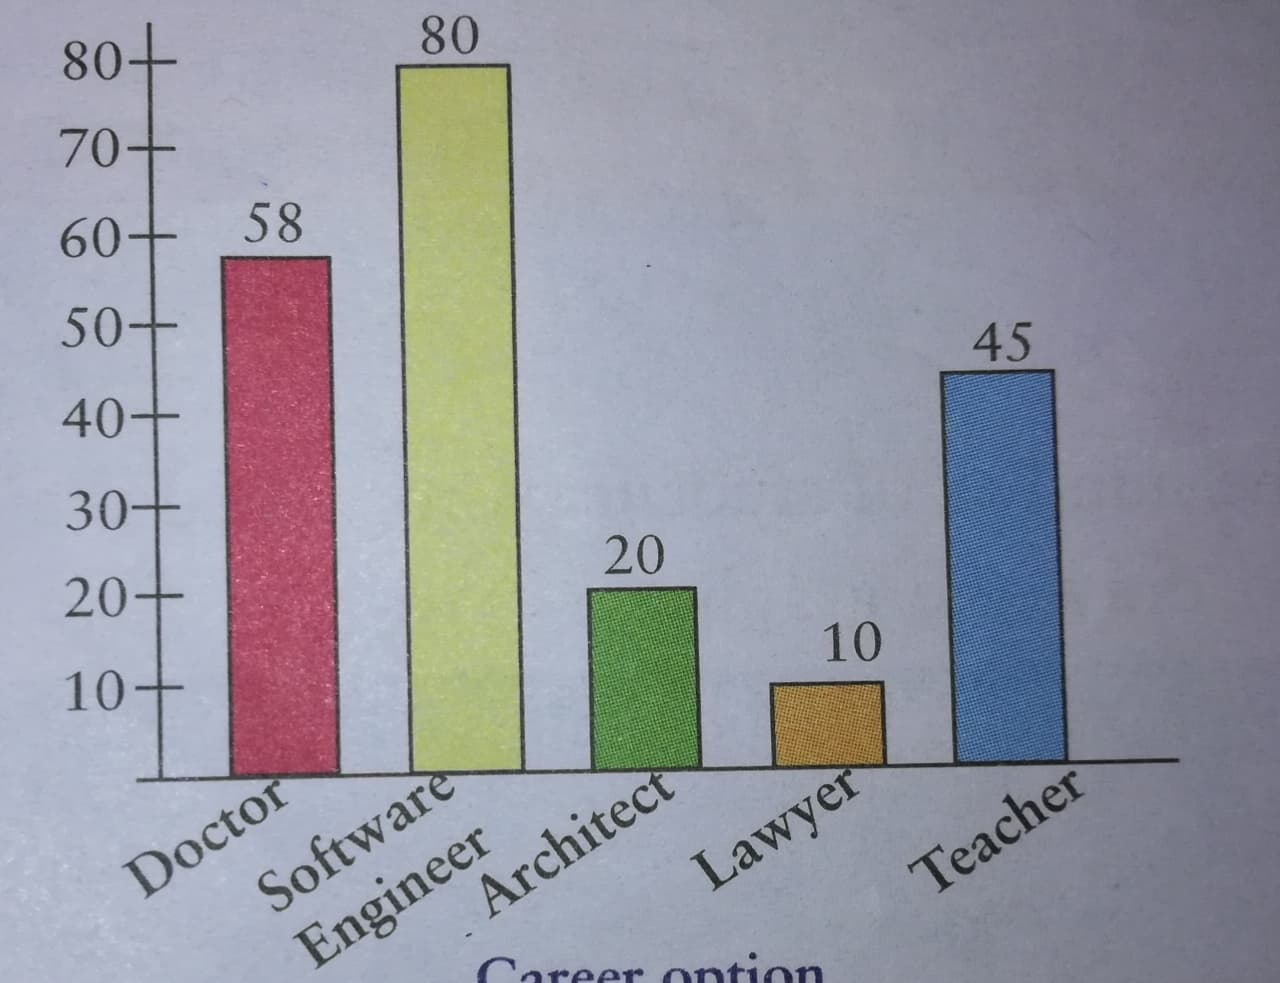
(a) Name the most popular career option chosen.
Ans: Software Engineer
(b) How many more students chose doctor as their doctor as their career option than the number of students who chose Teacher as their career?
Ans: 13 students
(c) Find the total number of students in the middle school?
Ans: 213 students
(d) List the careers chosen from most to least popular.
Ans: Software Engineer, Doctor, Teacher, Architect, Lawyer.
Leave a Reply