RS Aggarwal Class 6 Math Twenty-Two Chapter Data Handling Exercise 22 Solution
EXERCISE 22
(1) Define the terms:
(i) DATA – The word data means information in the form of numerical figures.
(ii) RAW DATA – Data obtained in the original form is called raw data.
(iii) ARRAY – Arranging the numerical figure in an ascending order is called an array.
(iv) TABULATION OF DATA – Arranging the data in a systematic form in the form of a table is called tabulation or presentation of the data.
(v) OBSERVATION – Each numerical figure in a ascending order data is called an observation.
(vi) FREQUENCY OF AN OBSERVATION – The number of times a particular observation occurs is called its frequency.
(vii) STATISTICS – It is the science which deals with the collection, presentation, analysis and interpretation of numerical data.
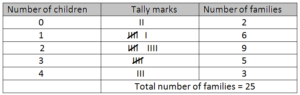
(2) The number of children in 25 families of a colony is given below:
2, 0, 2, 4, 2, 1, 3, 3, 1, 0, 2, 3, 4, 3, 1, 1, 1, 2, 2, 3, 2, 4, 1, 2, 2.
Represent the above data in form of a frequency distribution table.
Solution: We may present the data, as shown below:
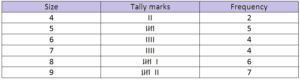
(3) The sale of shoes of various sizes at a shop on a particular day is given below:
6, 9, 8, 5, 5, 4, 9, 8, 5, 6, 9, 9, 7, 8, 9, 7, 6, 9, 8, 6, 7, 5, 8, 9, 4, 5, 8, 7.
Represent the above data in form of a frequency distribution table.
Solution: We may present the data, as shown below:
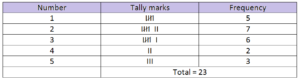
(4) Construct a frequency table for the following:
3, 2, 5, 4, 1, 3, 2, 2, 5, 3, 1, 2, 1, 1, 2, 2, 3, 4, 5, 3, 1, 2, 3.
Solution: We may present the data, as shown below:
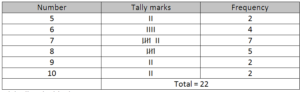
(5) Construct a frequency table for the following:
7, 8, 6, 5, 6, 7, 7, 9, 8, 10, 7, 6, 7, 8, 8, 9, 10, 5, 7, 8, 7, 6.
Solution: We may present the data, as shown below:
(6) Fill in the blanks:
(i) Data means information in the form of numerical figures.
(ii) data obtained in the original form is called raw data.
(iii) Arranging the numerical figures in an ascending or a descending order is called an array.
(iv) The number of times a particular observation occurs is called its frequency.
(v) Arranging the data in the form of a table is called tabulation.
Leave a Reply