RS Aggarwal Class 6 Math Twenty-Four Chapter Bar Graph Exercise 24 Solution
EXERCISE 24
BAR GRAPH – A bar graph is a pictorial representation of numerical data in the form of rectangles of equal width and varying heights.
(1) Look at the bar graph given below.
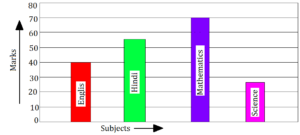
Read it carefully and answer the questions given below:
(i) What information does the bar graph give?
Ans: The given bar graph shows the marks obtained by a student in each of the four subjects in an examination.
(ii) In which subject is the student poorest?
Ans: The student is poorest in science.
(iii) In which subject is the student best?
Ans: The student is best in Mathematics.
(iv) In which subject did he get more than 40 marks?
Ans: He got more than 40 marks in Hindi and Mathematics.
(2) In a survey of 60 families of a colony, the number of members in each family was recorded and the data been represented by bar graph given below:
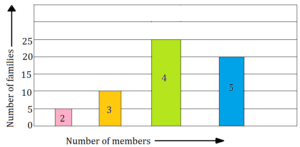
Read the bar graph carefully and answer the following questions:
(i) What information does the bar graph give?
Ans: The given bar graph shows the number of members in each of the 60 families of a colony.
(ii) How many families have 3 members?
Ans: 10 families have 3 members each.
(iii) How many couples have no child?
Ans: 5 couples have no child.
(iv) Which type of family is the most common?
Ans: A family of 4 members is most common.
(3) Look at the bar graph given below:
Study the bar graph carefully and answer the questions given below:
(i) In which week was the production maximum?
Ans: The production was maximum in the 2nd week.
(ii) In which week was the production minimum?
Ans: The production was minimum in the 4th week.
(iii) What is the average production during these five weeks?
Ans: The average production is 720 per week.
(iv) How many cycles were produced in the first 3 weeks?
Ans: 2400 cycles were produced in the first three weeks.
(4) 51 students from a locality use different modes of transport to school, as shown as by the bar graph given below:
(i) What does the above bar graph show?
Ans: The given bar graph shows the different modes of transport to school used by 51 students of a locality.
(ii) Which mode of transport is used by maximum number of students?
Ans: Maximum number of students use bicycle for going to school.
(iii) How many students use bus for going to school?
Ans: 14 students use bus for going to school.
(iv) How many students of the locality do not use bus for going to school?
Ans: 37 students do not use bus for going to school.
Leave a Reply